


Burbio School Tracker: Cities in California
This week we break down recently announced enrollments in California, plus look at new data from Burbio's expanding school board meeting service, which now covers 36% of all K-12 students.

Burbio is attending the ASU + GSV Summit this week. We would love to connect if you will be there.
1. California recently announced a 2022-23 public school enrollment decline of 0.67% versus 2021-22. Below is a breakdown by locale, with the most recent year in yellow. City and suburban locales both declined versus the previous year:

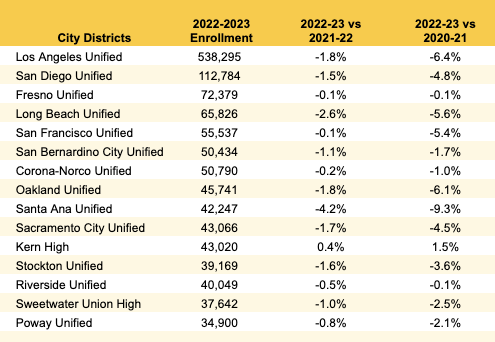
Below we take a look at the top city districts in California, as classified by NCES, and compare their enrollment shifts versus last year and two years ago. The top 15 districts in this category all experienced year-over-year declines:
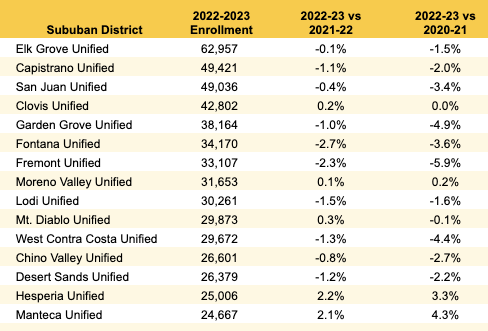
Below is a breakdown of largest suburban districts, which offer a mix of increases and decreases:
Below are grade-level shifts for California, which had a big jump in kindergarten:

2. Burbio has increased our coverage to 699 school board documents covering 36% of US K-12 students. We will be rolling out the service to clients in the coming weeks.
We ran a searches for two dozen words related to the environment and sustainability (examples include solar, sustainable, EV, energy efficiency) and 28% of the districts reference at least one term in their most recent meetings.
Below is a search against administrative and budgeting terms. We see widespread references in this category to next academic year, funding, and enrollment:

In last week's substack we provided several charts related to staffing, recruitment and retention. Below are references to staffing positions in our expanded Board meeting database:
